使用 Prometheus 和 Grafana 监控 Linux/Windows 服务器
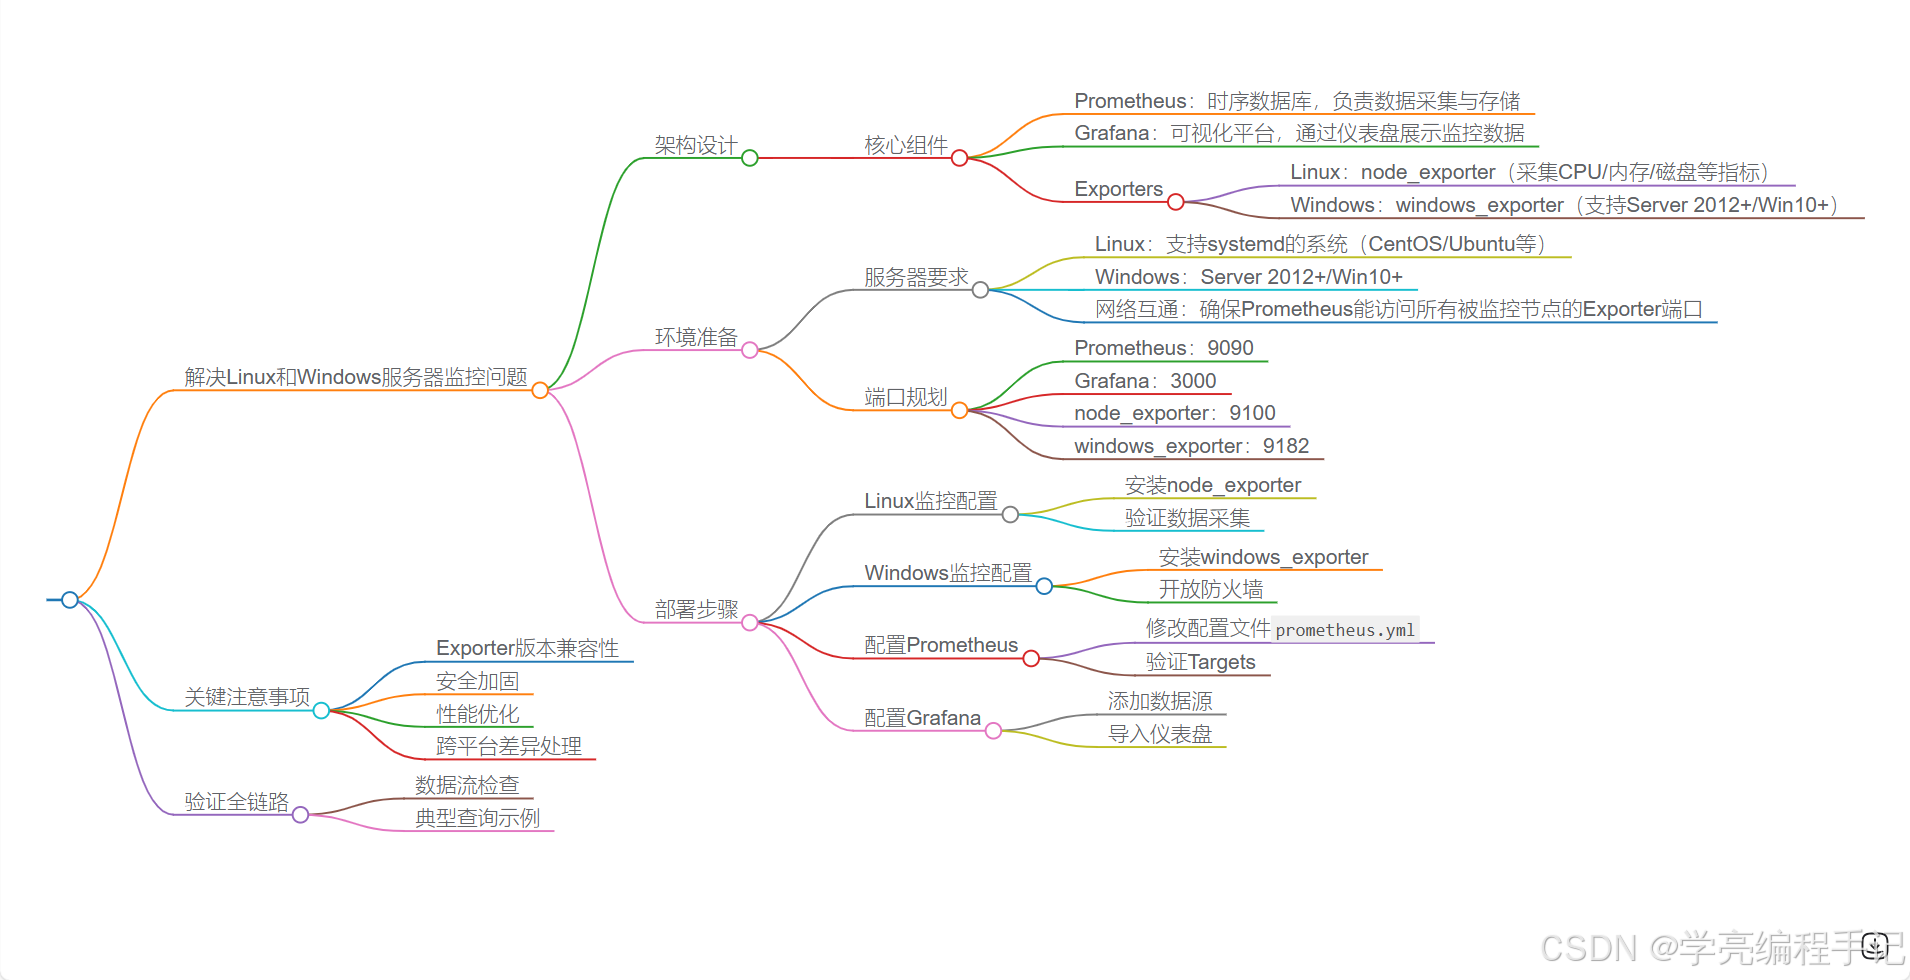
分步解决方案:使用 Prometheus 和 Grafana 监控 Linux/Windows 服务器
一、架构设计
- 核心组件:
- Prometheus:时序数据库,负责数据采集与存储
- Grafana:可视化平台,通过仪表盘展示监控数据
- Exporters:
- Linux 使用
node_exporter(采集 CPU/内存/磁盘等指标) - Windows 使用
windows_exporter(支持 Server 2012+/Win10+)
- Linux 使用
二、环境准备
-
服务器要求:
- Linux: 支持 systemd 的系统(CentOS/Ubuntu 等)
- Windows: Server 2012+/Win10+(需验证 windows_exporter 版本兼容性)
- 网络互通:确保 Prometheus 能访问所有被监控节点的 Exporter 端口
-
端口规划:
| 组件            | 默认端口 | 协议  |
|-----------------|---------|-------|
| Prometheus      | 9090    | HTTP  |
| Grafana         | 3000    | HTTP  |
| node_exporter   | 9100    | HTTP  |
| windows_exporter| 9182    | HTTP  |  # 根据版本可能不同
三、部署步骤
1. Linux 监控配置
-
安装 node_exporter:
# 下载二进制包 wget https://github.com/prometheus/node_exporter/releases/download/v1.6.1/node_exporter-1.6.1.linux-amd64.tar.gz tar xvfz node_exporter-* && cd node_exporter-* # 启动服务(建议配置为 systemd 服务) ./node_exporter --web.listen-address=":9100" -
验证数据采集:
curl http://localhost:9100/metrics # 应返回指标数据
2. Windows 监控配置
-
安装 windows_exporter:
- 方法一:通过 MSI 安装包(推荐)
# 下载地址:https://github.com/prometheus-community/windows_exporter/releases msiexec /i windows_exporter-0.24.0-amd64.msi ENABLED_COLLECTORS="cpu,memory,net,logical_disk" - 方法二:命令行安装
.windows_exporter.exe --collectors.enabled "cpu,memory,os,net"
- 方法一:通过 MSI 安装包(推荐)
-
开放防火墙:
New-NetFirewallRule -DisplayName "windows_exporter" -Direction Inbound -Action Allow -Protocol TCP -LocalPort 9182
3. 配置 Prometheus
-
修改配置文件
prometheus.yml:scrape_configs: - job_name: 'linux' static_configs: - targets: ['linux_ip:9100'] - job_name: 'windows' static_configs: - targets: ['windows_ip:9182'] params: # Windows 特定参数(可选) collect[]: ['cpu','memory']systemctl restart prometheus # 重启生效 -
验证 Targets:
访问http://prometheus_ip:9090/targets查看所有节点状态是否为 UP
4. 配置 Grafana
-
添加数据源:
- 访问
http://grafana_ip:3000 - 导航至 Configuration > Data Sources > Add Prometheus
- URL 填写
http://prometheus_ip:9090
- 访问
-
导入仪表盘:
- Linux: 使用 ID
8919(Node Exporter Full) - Windows: 使用 ID
10467(Windows Exporter Dashboard) - 操作路径:Create > Import > 输入 ID 后加载
- Linux: 使用 ID
四、关键注意事项
-
Exporter 版本兼容性:
- Windows Server 2008 需使用
windows_exporterv0.16.0 以下版本 - 定期检查 Exporter 更新日志
- Windows Server 2008 需使用
-
安全加固:
- 建议为 Exporter 配置 HTTPS 和 Basic Auth(参考引用中 BearerToken 方法) - 限制 Prometheus 的访问 IP 范围 -
性能优化:
- 调整 Prometheus 的 `scrape_interval`(默认 15s) - 使用 `-storage.tsdb.retention.time` 控制数据保留周期 -
跨平台差异处理:
- Windows 磁盘指标命名规则与 Linux 不同(如 `logical_disk` vs `mountpoint`)
- Grafana 查询语句需区分操作系统类型(使用 `instance` 标签过滤)
五、验证全链路
- 数据流检查:
Exporter → Prometheus(查询表达式验证)→ Grafana(图表渲染) - PromQL查询示例:
# Linux CPU 使用率
100 - (avg by (instance) (rate(node_cpu_seconds_total{mode="idle"}[5m])) * 100)
# Windows 内存使用
(windows_memory_commit_limit - windows_memory_available_bytes) / windows_memory_commit_limit * 100